


Introduction
Spirometry is the most widely used pulmonary function test (aka lung function test). It measures the volume and flow of air during inspiration and expiration; it is an assessment of how effectively the lungs can be emptied and filled. Spirometry uses various measures of inspired and expired air to give an indication of any underlying lung disease.
Modern spirometry is usually performed in the GP surgery or respiratory clinic.
It can be used to assist the diagnosis of:
Although, results need to be interpreted in clinical context and spirometry alone cannot always provide an exact diagnosis.
Sometimes, spirometry results are talked about as being:
- On obstructive pattern – e.g.
- COPD
- Including Alpha1-antitrypsin deficiency
- Asthma
- Cystic fibrosis
- Bronchiectasis
- COPD
- A restrictive pattern – e.g.
- Pulmonary fibrosis
- Neuromuscular conditions
- Heart Failure
- Sarcoidosis
- Obesity
There is a separate article about differentiating obstructive vs restrictive lung disease.
Spirometry is also used to monitor the effectiveness of treatment in lung conditions.
Definitions
There are a lot of terms involved in measuring lung function! These include:
- FVC – Forced vital capacity
- This is a measure of the maximum volume of air than can be exhaled
- Normal values vary based on age, sex and height
- FEV1 – Forced expiratory volume in one second
- The volume expired during the first second of maximum expiration
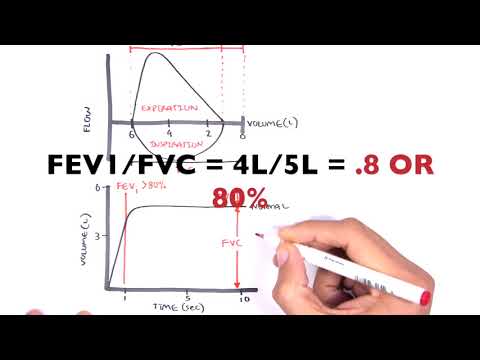
- FEV1/FVC – The FEV1 expressed as a percentage of the FVC
- Normal value – 75-80%
- FEV6 – Forced expiratory volume in six seconds
- Often considered synonymous with the FVC – FVC values which take longer than 6 seconds to perform are thought to less accurate. This also leads to calculations such as FEV1/FEV6
- PEF – Peak expiratory flow – the maximal expiratory flow rate – occurs early in the forced expiration phase
- FEF – Forced expiratory Flow
- FIF – Forced inspiratory Flow
- FEF25-75% – Forced expiratory flow in the middle half of expiration
- A more sensitive measurement of airway narrowing than FEV1
- However, very variable from individuals and easily inaccurate in when FVC is reduced
- Flow-Volume Loop – This shows maximum inspiratory and expiratory effort on the same graph
- Volume-time curve – shows how quickly air can be expelled from the lungs (FEV1), and the total volume expelled (FVC)
Understanding these concepts is a bit easier if we visualise the volumes graphically:

The Graphs
There are typically two types of graph produced by spirometry.
- Flow-Volume loop
- Volume-time curve
Understanding the patterns seen in both of these can help to diagnose the various lung conditions.
Volume-Time Curve
This involves a single breath, taken after full inspiration, after which the patient is asked to exhale as quickly and fully as possible. The rate at which the air is expelled gives an indication of the function of the lungs.
This curve is useful for measuring the FVC and FEV1, and subsequently the FEV1/FVC ratio.
| Curve | Interpretation |
|---|---|
 |
|
 |
|
 |
|

Flow-volume loop
During this part of the test, the patient takes multiple FVC breaths in and out through the spirometer. There is no indication of time included on this graph, just the volume (x-axis) plotted against the rate of flow on the y-axis.
During the “live” tests, multiple “loops’ are plotted on top of each other to see an “average” of the lung function. The graph is traced in real time in a clockwise direction.
What is important about the flow-volume loop is the pattern of the expiratory phase. FVC and FEV1 cannot be easily determined from these graphs.
| Loop | Interpretation |
|---|---|
NORMAL FLOW VOLUME LOOP
 |
|
| OBSTRUCTIVE DISEASE
|
|
| RESTRICTVIE DISEASE
|
|


Interpreting the results
Typically the results can be divided into 4 categories
- Normal
- Obstructive
- Which could be subdivided into reversible (asthma) and non-reversible (COPD)
- Restrictive
- Mixed
Obstructive disease
- A reduction in airflow
- FVC often normal
- FEV1 reduced <80% predicted
- FEV1/FVC ratio <70%
- “Classical” definition
- FEV1/FVC < LLN
- LLN – “Lower limit of normal”
- A more modern definition
- LLN defined by age, gender, weight
Bronchodilator reversibility
- Determines degree of responsiveness of always to bronchodilators
- Helps to confirm, the presence of obstructive disease if reversibility is present (particularly asthma)
- Reversibility is defined as:
- >12% AND 200ml increase in FEV1 OR FVC
- Assessed by:
- Giving short acting B-agonist (e.g. salbutamol 2-6 puffs via spacer)
- Repeat spirometry 10 minutes later
- Failure to respond does not determine the need to prescribe bronchodilators
- Many patients with COPD wills till benefit from bronchodilators even if they don’t meet the above criteria
- Also provides a good opportunity to check inhaler technique
- If patient doesn’t respond – then ensure adequate inhaler technique
Restrictive disease
- A reduction in lung capacity
- FVC reduced
- FEV1 often normal
- FEV1/FVC ratio usually normal
- FVC < LLN

Performing The Test
Contraindications
Performing spirometry causes a significant increase in intra-thoracic pressure. As such, it should not be formed in the following patients:
- Pneumothorax within the last 6 weeks
- Acute coronary syndrome within the last 4 weeks
- Haemoptysis within last 48 hours
- Thoracic, abdominal or eye surgery (including cataracts) within last 6 weeks
- Known thoracic, abdominal or cerebral aneurysm
- Known TB or influenza, or other acute illness
The Test
Patients sit upright in a chair. They wear a nose clip, and then are asked to blow out forcibly into a tube, with the lips tightly sealed around the tube, from a position of maximum inspiration.
- Patients should refrain from using bronchodilators on the day of the test before the test is performed – its difficult to assess airway reversibility if they have already taken their medication!
- Not smoke on the day of the test
- Avoid strenuous exercise on the day of the test
- Avoid alcohol on the day of the test
- Avoid eating a large meal in the 4 hours before the test
- Avoid restrictive clothing
Indications
- Symptoms of respiratory disease
- Chronic cough
- SOB
- Wheeze
- Orthopnoea (SOB on lying flat
- Sputum production
- Signs
- Cyanosis
- Wheeze
- Unexplained crackles
- Hypoxia
- Abnormal CXR – e.g. hyperexpansion
Summary
- Spirometry is a way of diagnosing the type of lung disease present
- With the help of history and examination, it is possilbe in most cases to ermine the exact lung disease present
- There are two types of graph to be familiar with – flow-volume loops and volume-time curves
- Don’t forget that patients can present with a mixed obstructive and restrictive pattern
- If you are still confused, then this youtube video from Armando Hasudungan (no association with almostadoctor) is a great explanation – but be aware that the flow-volume curves he uses use a reversed axis compared to those discussed in this video (see tables of charts above)
References
- Spirometry – RACGP
- A Stepwise Approach to the Interpretation of Pulmonary Function Tests
- Murtagh’s General Practice. 6th Ed. (2015) John Murtagh, Jill Rosenblatt
- Oxford Handbook of General Practice. 3rd Ed. (2010) Simon, C., Everitt, H., van Drop, F.
- Beers, MH., Porter RS., Jones, TV., Kaplan JL., Berkwits, M. The Merck Manual of Diagnosis and Therapy